Understanding your website visitors’ experiences – both good and bad – can be valuable feedback for an affiliate website owner. One tool that can provide this feedback is Hotjar. If you’re new to Hotjar or heatmap tools in general, this article aims to shed light on how Hotjar can help you identify and address your website visitor pain points effectively.
What is Hotjar?
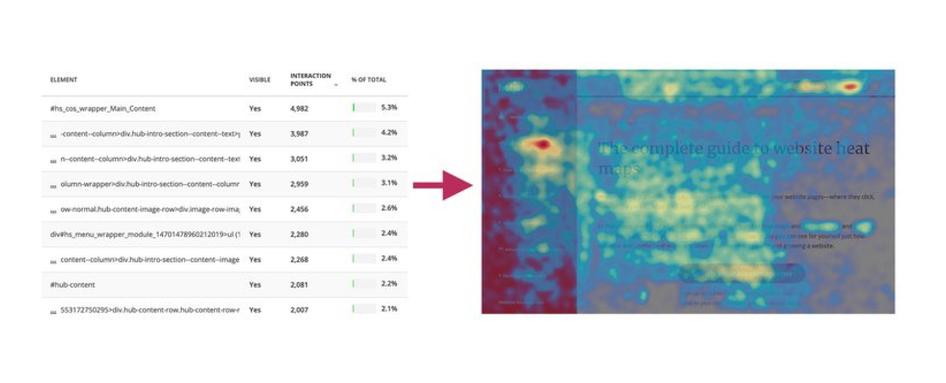
Hotjar is a free online tool designed to provide insights into user behavior on your website. Its primary features include heatmaps, session recordings, surveys, and feedback polls. For those unfamiliar with the term, a heatmap is a graphical representation of data in which values are depicted by colors. On Hotjar, heatmaps display where visitors click, move, and scroll on your website.
Why Use Hotjar Heatmaps?
Heatmaps offer a visually intuitive way to comprehend user behavior. Traditional analytics tools may present overwhelming data sets, but heatmaps simplify complex information, making them accessible to users of all levels. By using color-coded visuals, Hotjar enables you to pinpoint areas of success and potential pain points more easily.
Types of Hotjar Heatmaps
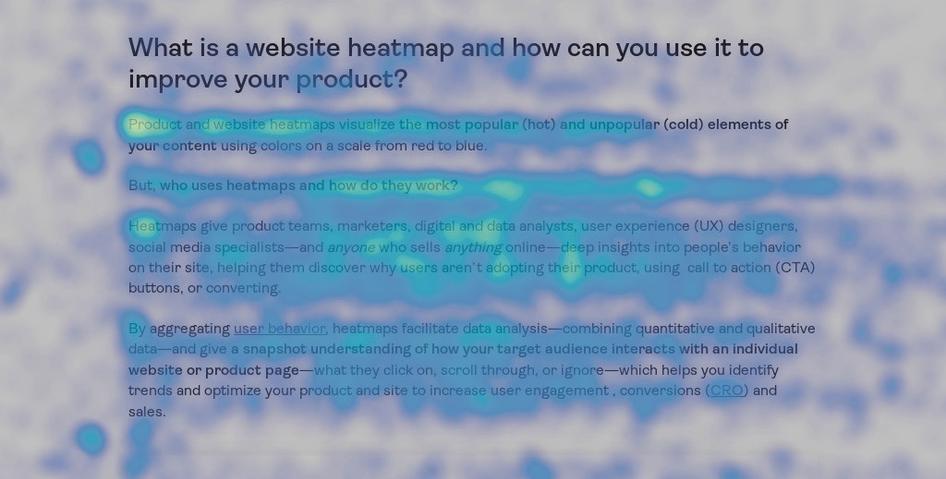
Click Map
A Click Map in Hotjar visually represents where users click the most on your website. It uses color gradients to indicate the frequency of clicks on different elements, such as buttons, links, or images.
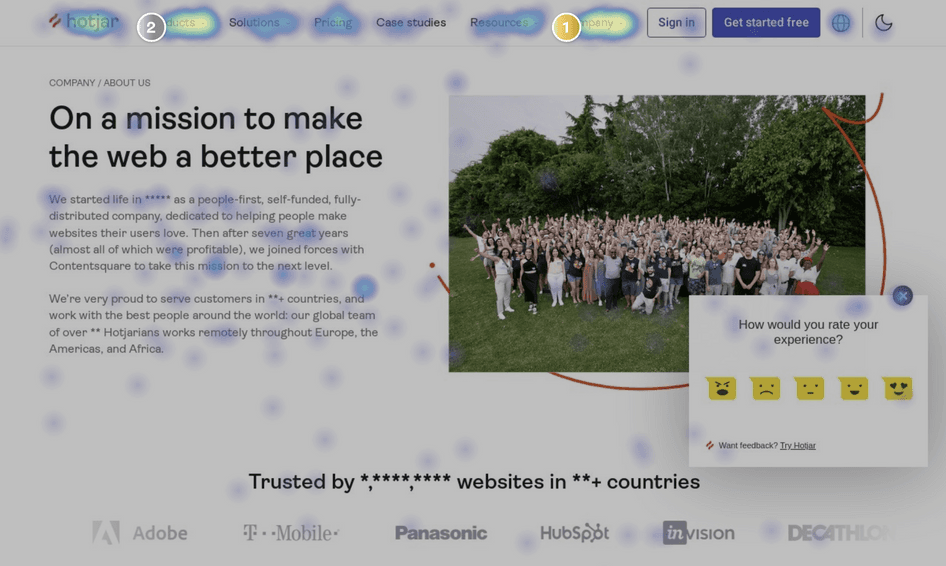
Move Map
The Move Map shows where users move their cursors on your website. It provides insights into the areas that grab the most attention, helping you understand user interest and engagement.
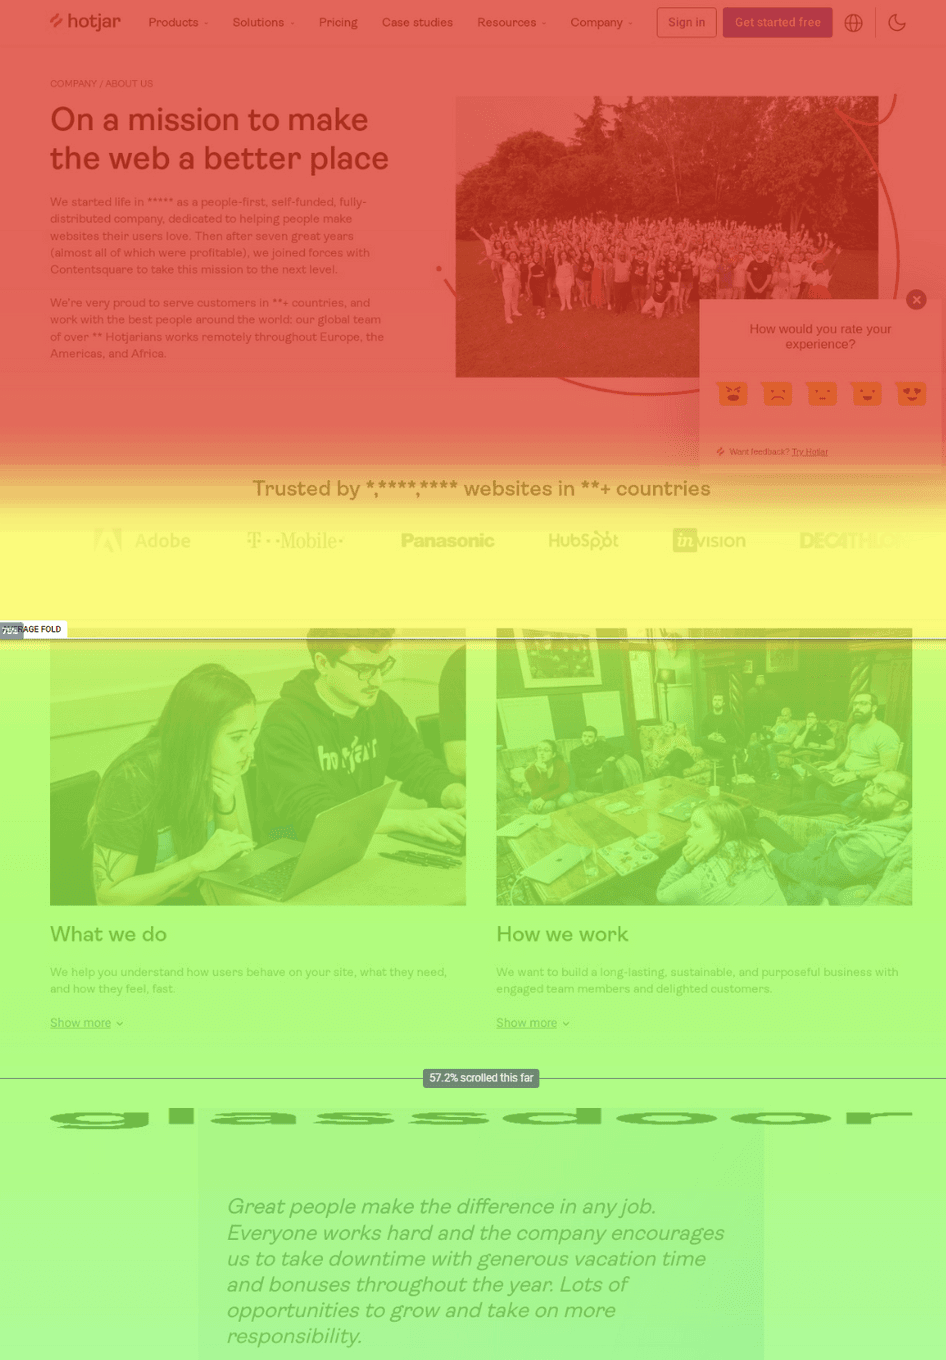
Scroll Map
The Scroll Map displays how far users scroll down each page. It helps you identify the scroll depth and understand if visitors are reaching the essential content at the bottom of the page.
Finding and Fixing Pain Points with Hotjar Heatmaps
Click Maps
By visually representing where users click, click maps can help businesses make data-driven decisions to enhance navigation and content engagement. Here are three examples of how click maps can be used:
Identifying Dead Clicks: If a click map reveals frequent interactions with non-clickable elements or areas without associated links, it indicates user confusion. Businesses can address this issue by making those elements clickable or providing clear instructions to guide users effectively.
Analyzing Call-to-Action (CTA) Effectiveness: Click maps can highlight the performance of various CTAs by showing the distribution of clicks on buttons or links. If a crucial CTA receives minimal engagement, businesses can experiment with its placement, design, or wording to optimize user response and encourage desired actions.
Spotting Form Abandonment: For websites with forms, click maps can expose the exact fields where users drop off. If there’s a consistent pattern of users abandoning a form at a specific point, businesses can streamline the form, reduce required fields, or provide additional context to increase completion rates.
Move Maps
Hotjar’s move maps provide a dynamic visualization of user mouse movements on a website, enabling businesses to uncover valuable insights and address pain points for their visitors. By analyzing move maps, businesses can understand user engagement patterns and make informed decisions to improve the overall user experience. For instance:
Cursor hesitation and looping: If move maps show users repeatedly hesitating or looping around specific elements, it suggests confusion or uncertainty. Businesses can address this by optimizing the layout, improving clarity, or adding explanatory content.
Skipped content areas: Move maps can reveal sections where users tend to quickly scroll without engagement, indicating potential disinterest. Identifying these areas allows businesses to reassess content relevance, ensuring that key information is more engaging and accessible.
Unexpected exits: Instances where users abruptly move the cursor toward the exit points on the webpage may indicate frustration or dissatisfaction. By examining these exit points on move maps, businesses can refine navigation, simplify processes, or provide additional guidance to retain user interest and engagement.
Scroll Maps
Hotjar’s scroll maps provide valuable insights into user behavior by visualizing how far visitors scroll down a webpage, enabling businesses to identify and address pain points for improved user engagement. Here are three examples of how scroll maps can be effectively utilized:
Content Visibility Analysis: Scroll maps reveal the visibility of different content sections as users scroll. If critical information is consistently overlooked because it’s placed too far down the page, businesses can reposition or emphasize that content to ensure it captures users’ attention.
Determining Optimal Content Length: Analyzing scroll maps helps businesses understand how much of their content users consume. If there’s a consistent drop-off at a certain point, it may indicate that the content is too lengthy or loses user interest. Adjusting content length or breaking it into more digestible sections can enhance engagement.
Identifying “Cold” Zones: Scroll maps highlight areas where users tend to abandon the page without scrolling, indicating a potential lack of interest or engagement. Businesses can focus on optimizing these initial sections, ensuring they convey key messages, value propositions, or compelling visuals to capture users’ attention right from the start.
Take Away
The insights gained from Hotjar and similar heatmap tools can show both positive and negative aspects of user interactions, aka valuable feedback. By understanding visitor behavior, preferences, and pain points, you can make informed decisions to enhance user satisfaction and optimize their websites effectively.

14 thoughts on “Finding and Fixing Website Visitor Pain Points with HotJar”
Comments are closed.